Introduction to Layers
What is a layer?
A layer is a visualization of data points with mark and encodings applied on it. Planer encoding (x, y) position the points in 2D plane and retinal encoding (color, shape, size) changes visual representation of the points based on value of some variable. So it is safe to say
layer = data + mark
Marks are analogous to plot types we have heard in other visualization libraries.
Muze provides atomic marks which you can use to compose layers. Following are the marks available in Muze:
- Bar
- Line
- Area
- Arc
- Text
- Point
- Tick
NOTE: Muze generates default definition of layers. You don't have to define a layer always, Muze generates layer's definition based on fields mapped to rows and columns and type of the fields (measure and dimension).
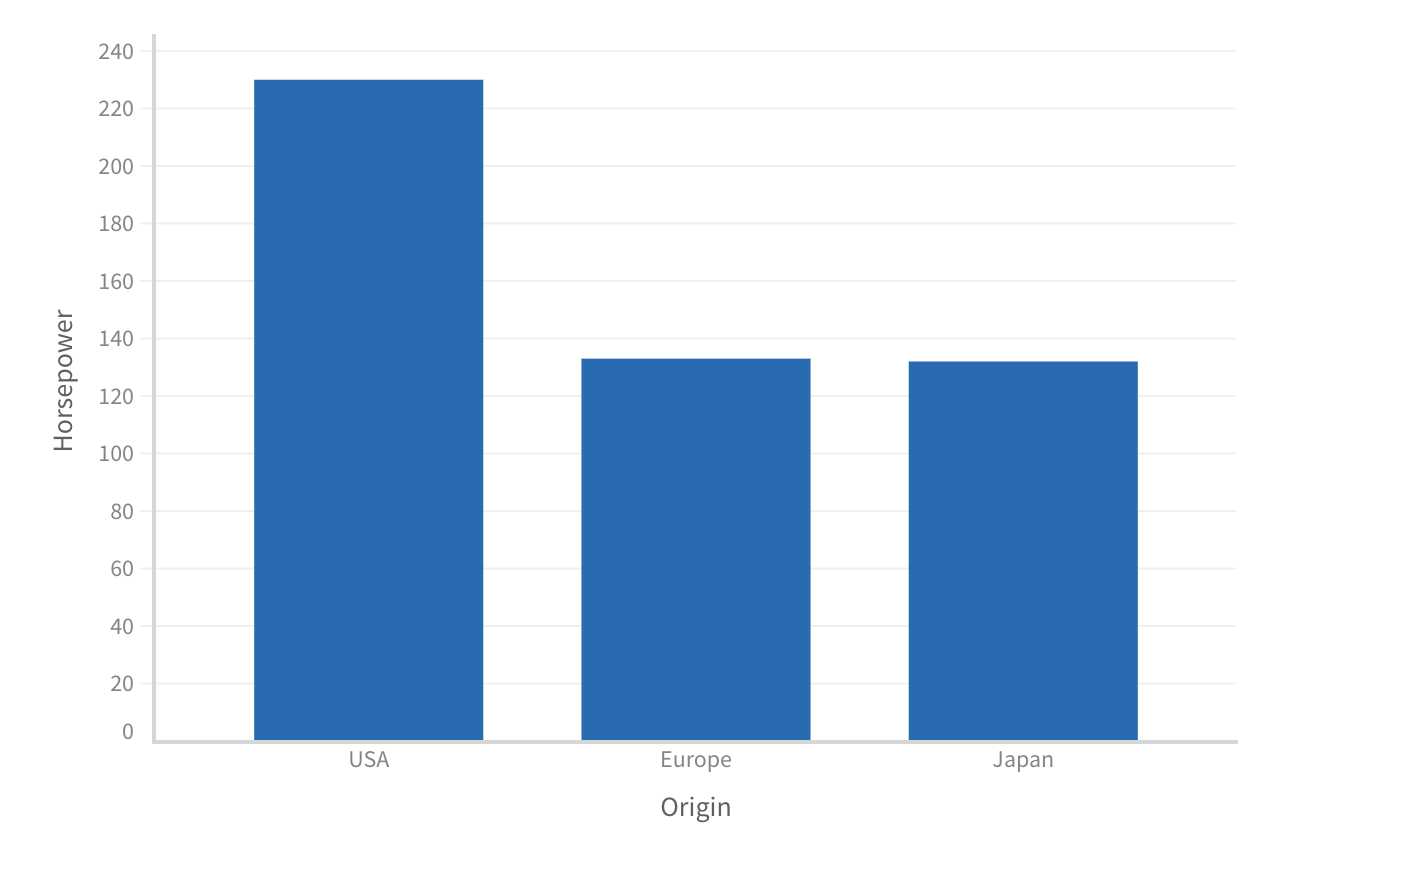
Simple bar plot example
const { muze, getDataFromSearchQuery } = viz;

const data = getDataFromSearchQuery();

muze
  .canvas()
  .rows(["Miles_per_Gallon"])
  .columns(["Year"])
  .layers([
    {
      mark: "bar",
      encoding: {
        y: "Horsepower",
        x: "Origin",
      },
    },
  ])
  .data(data)
  .mount("#chart");